Newbs, Ruby, Profiling Memory Leaks Using Memprof, And Web Scraping with Mechanize
So for the past four weeks in my spare time, I’ve been writing a sweet web scraping application for a personal research project. After overcoming the majority of regex and pattern matching challenges, I was finally able to get my spider a crawlin’ and then go to bed.
When I woke, I was excited to see what little bits of interesting information my application had found. But instead, I saw that it had dumped stack. And as a Ruby newb, here starts the long and arduous journey to understanding how to profile a ruby application. Yikes!
Definition of “Memory Leak” in Ruby Link to heading
From what I have researched and my own personal experience. You (the developer) can’t really create a traditional memory leak.
Traditional Leak Link to heading
- Allocate Memory (malloc, alloc)
- Assign Value (Object, string, int, etc…) To Memory
- No longer needing the value, you forget to release (dealloc) it
- The data stays in memory during the life of your application
- Particularly problematic when iterating or looping and assigning new values to memory
Ruby Memory Leak Link to heading
- You assign a value to a variable
- You expect that the value has fallen out of scope
- Instead, it persists in memory as some Object you are unaware of is retaining it
- Not really noticeable in small applications or page requests where memory is freed at the end of the run cycle
Thats the basic difference (from my understanding). Please correct me if I am off on something.
Tips To Identify That You Have A Memory Leak Link to heading
So a couple quick ways that you can tell you could have a memory leak.
Total Object Count Link to heading
Try printing the total Object count to screen while your application is running. Should the count increase over time, this would indicate that you are retaining objects. Please note that you need to force Garbage Collection regularly to make sure that the total Object count is not just the logical growth cycle of your application.
Monitor Memory Usage Link to heading
Monitor the Process I.D. (PID) of your application and look to see if memory usage increases over a given period of time. Should it continue to go up, this would strengthen the argument that you have a leak.
Again, these are two quick methods I used to come to the following point of action.
“Crap, it looks like something is going on with memory usage, I better take a closer look.”
Try forcing your Objects to release Link to heading
I learned rather quickly, that by design, Ruby does not allow you to release or unset your Objects manually. So there ya go.
Set your Objects to nil to identify they are ready to be Garbage Collected Link to heading
I tried this while grasping at straws, it was a dumb idea. I was taking shots in the dark and I wouldn’t advise going this route. What I needed was a really deep look at what Objects I was storing in memory so I could develop a story on why my application was leaking.
Memprof & its visualization partner Memprof.com Link to heading
This is when I happened across the git repo Memprof by Joe Damato (@joedamato http://timetobleed.com). It was exactly what I needed.
Using Ruby 1.8.7, Install Memprof Link to heading
$ gem install memprofSignup for memprof.com Link to heading
memprof.com (be aware, that when using this tool, it publishes your code to the web)
Include Memprof (at the VERY beginning of your application, just in case you want to profile your included gems too)
require `gem which memprof/signal`.chompWrap Run Loop in Memprof.trace Link to heading
def run_loop
  while next_link?(@browser.page) do
    Memprof.trace{
      iterate_search_page(@browser.page)
      click_next_link(@browser.page)
    }
  end
end
Run Your Application Link to heading
$ ruby web_crawler.rbFind Your Process ID of application Link to heading
$ ps -ef | grep web_crawler.rbAfter 5 minutes, Dump Trace To Memprof.com Link to heading
$ memprof --pid 27890 --name example_dump --key YOUR_API_KEYAnalyze the heap visually with Memprof.com Link to heading
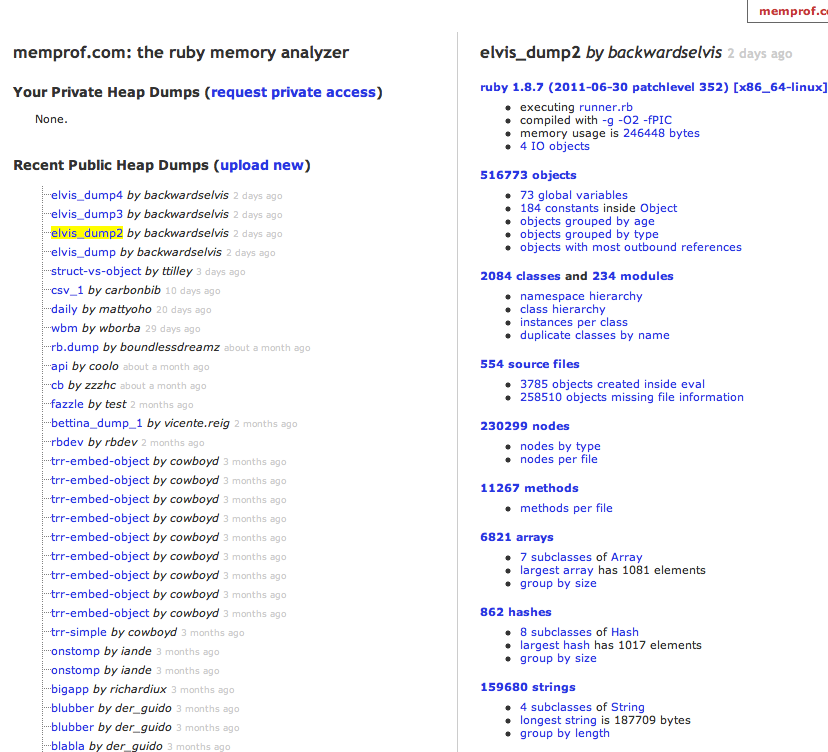
Click On (objects with most outbound references) Link to heading
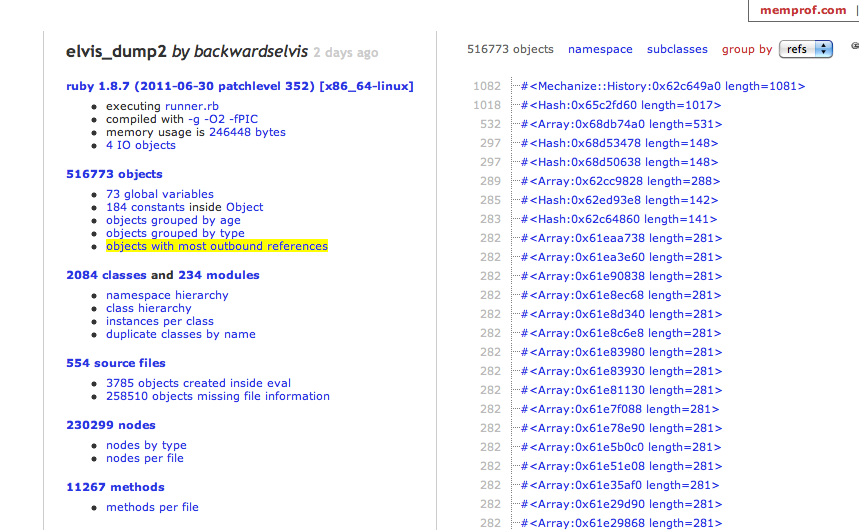
On the far right, you will see an Object with the “Mechanize” class, and its length is 1081. This piece of information was critical in identifying that a Mechanize object I had instantiated was retaining a crap pile of objects.
What was the issue? Link to heading
So it turns out that by default, Mechanize does NOT set a max_history=() value. What does this mean? Basically, my web crawler was storing every visited page, in memory, in entirety. BEWARE!
Hat tip ( @bradhe, @tim_linquist, @joedamato, @elazar)
Note: My “Ruby Memory Leaks” definition is not entirely correct, but for the newbs out there reading this, I think trying to break it down further could potentially confuse you. If you want to understand Ruby memory allocation at some point, go watch this video by Joe Damato. (link)